*These data are updated on a quarterly basis and are cumulative through December 31, 2021.
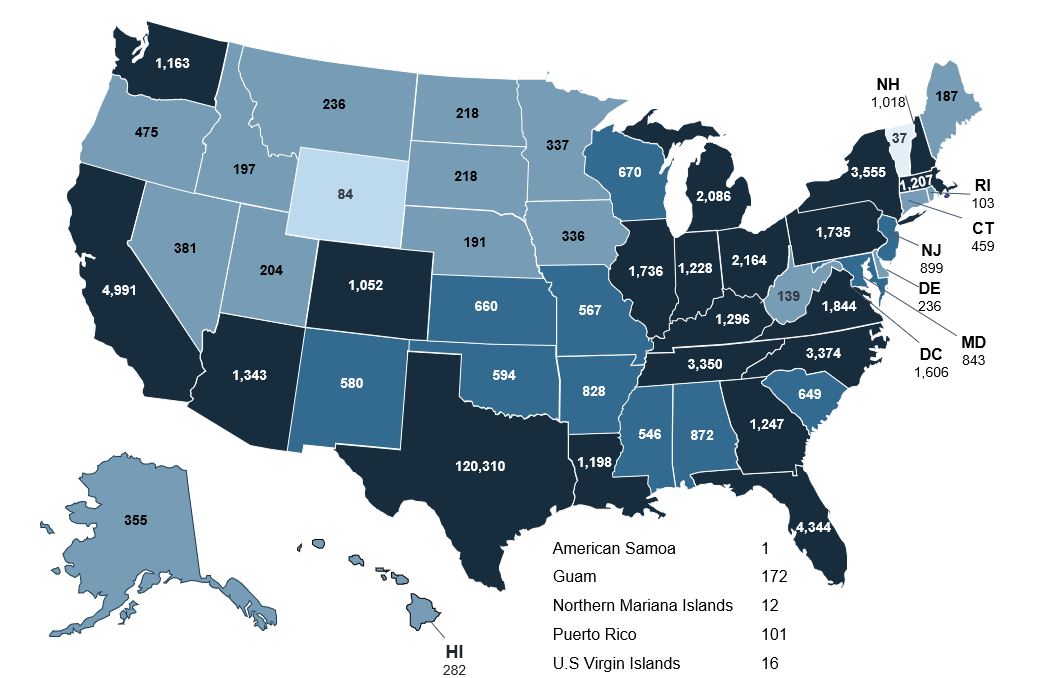
Participants of NHTTAC T/TA were located across the United States and its territories. The location of participants is shown below.
I’m at a point now where I could be that leader that I always dreamed to be. [HTLA] really built me up as a leader…and was very much affirming in a lot of ways.
HTLA Fellow
Events
Population
Organization Type
Participants reported the type of organization in which they work.
Short-Term Outcomes
NHTTAC’s impact was assessed by asking participants to report their accomplishments since participating in NHTTAC T/TA. The following demonstrates the proportion of participants who reported short-term outcomes as a result of NHTTAC T/TA.
Increased their knowledge related to the topics
Increased their practical skills related to the topics
Trainings were trauma-informed
Trainings were survivor-informed
Long-Term Outcomes
NHTTAC’s impact was assessed by asking participants to report their accomplishments since participating in NHTTAC T/TA. The following demonstrates the proportion of participants who reported long-term outcomes as a result of NHTTAC T/TA.
Increased their knowledge related to the topics

Shared materials with colleagues
Trained/educated others in content/skills learned

Integrated victim-centered, survivor-informed strategies
Improved identification and reporting methods for trafficking

Raised public awareness/advocacy/outreach activities offered to victims

Expanded services or types of services
Consultant Diversity
Gender
Most consultants identified as female (83%), male (13%), not specified (3%), transgender (1%), and two-spirit (1%).
Race
Most consultants identified as white (43%).
Ethnicity
Most consultants identified as not specified (82%).
